Exploratory Data Analysis
Contents
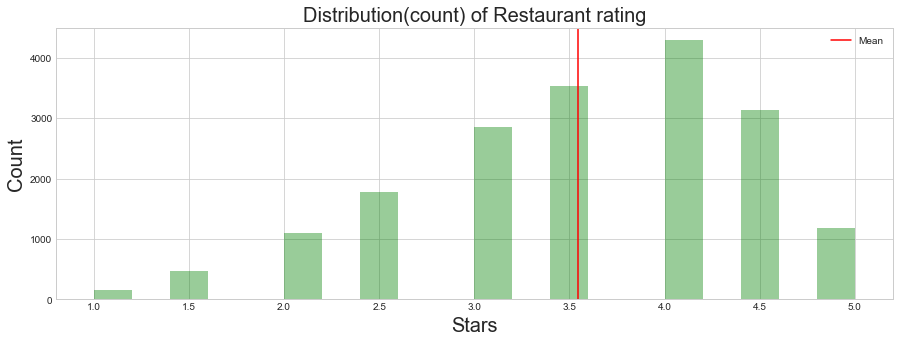
- Distribution count of Restaurant rating
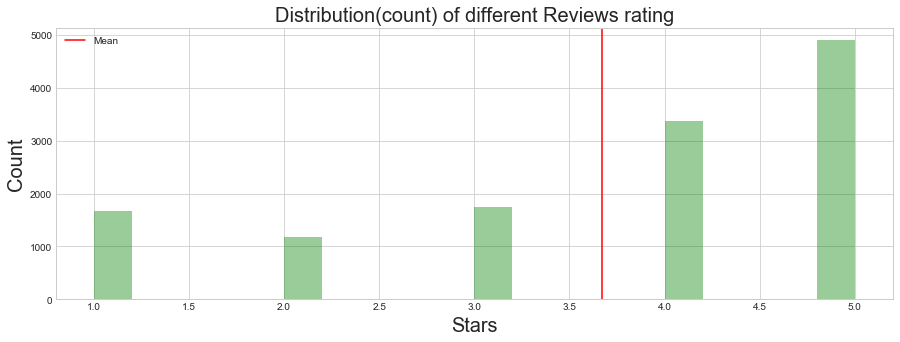
- Distribution count of Reviews rating for restaurants
- Distribution count of user rating for restaurants
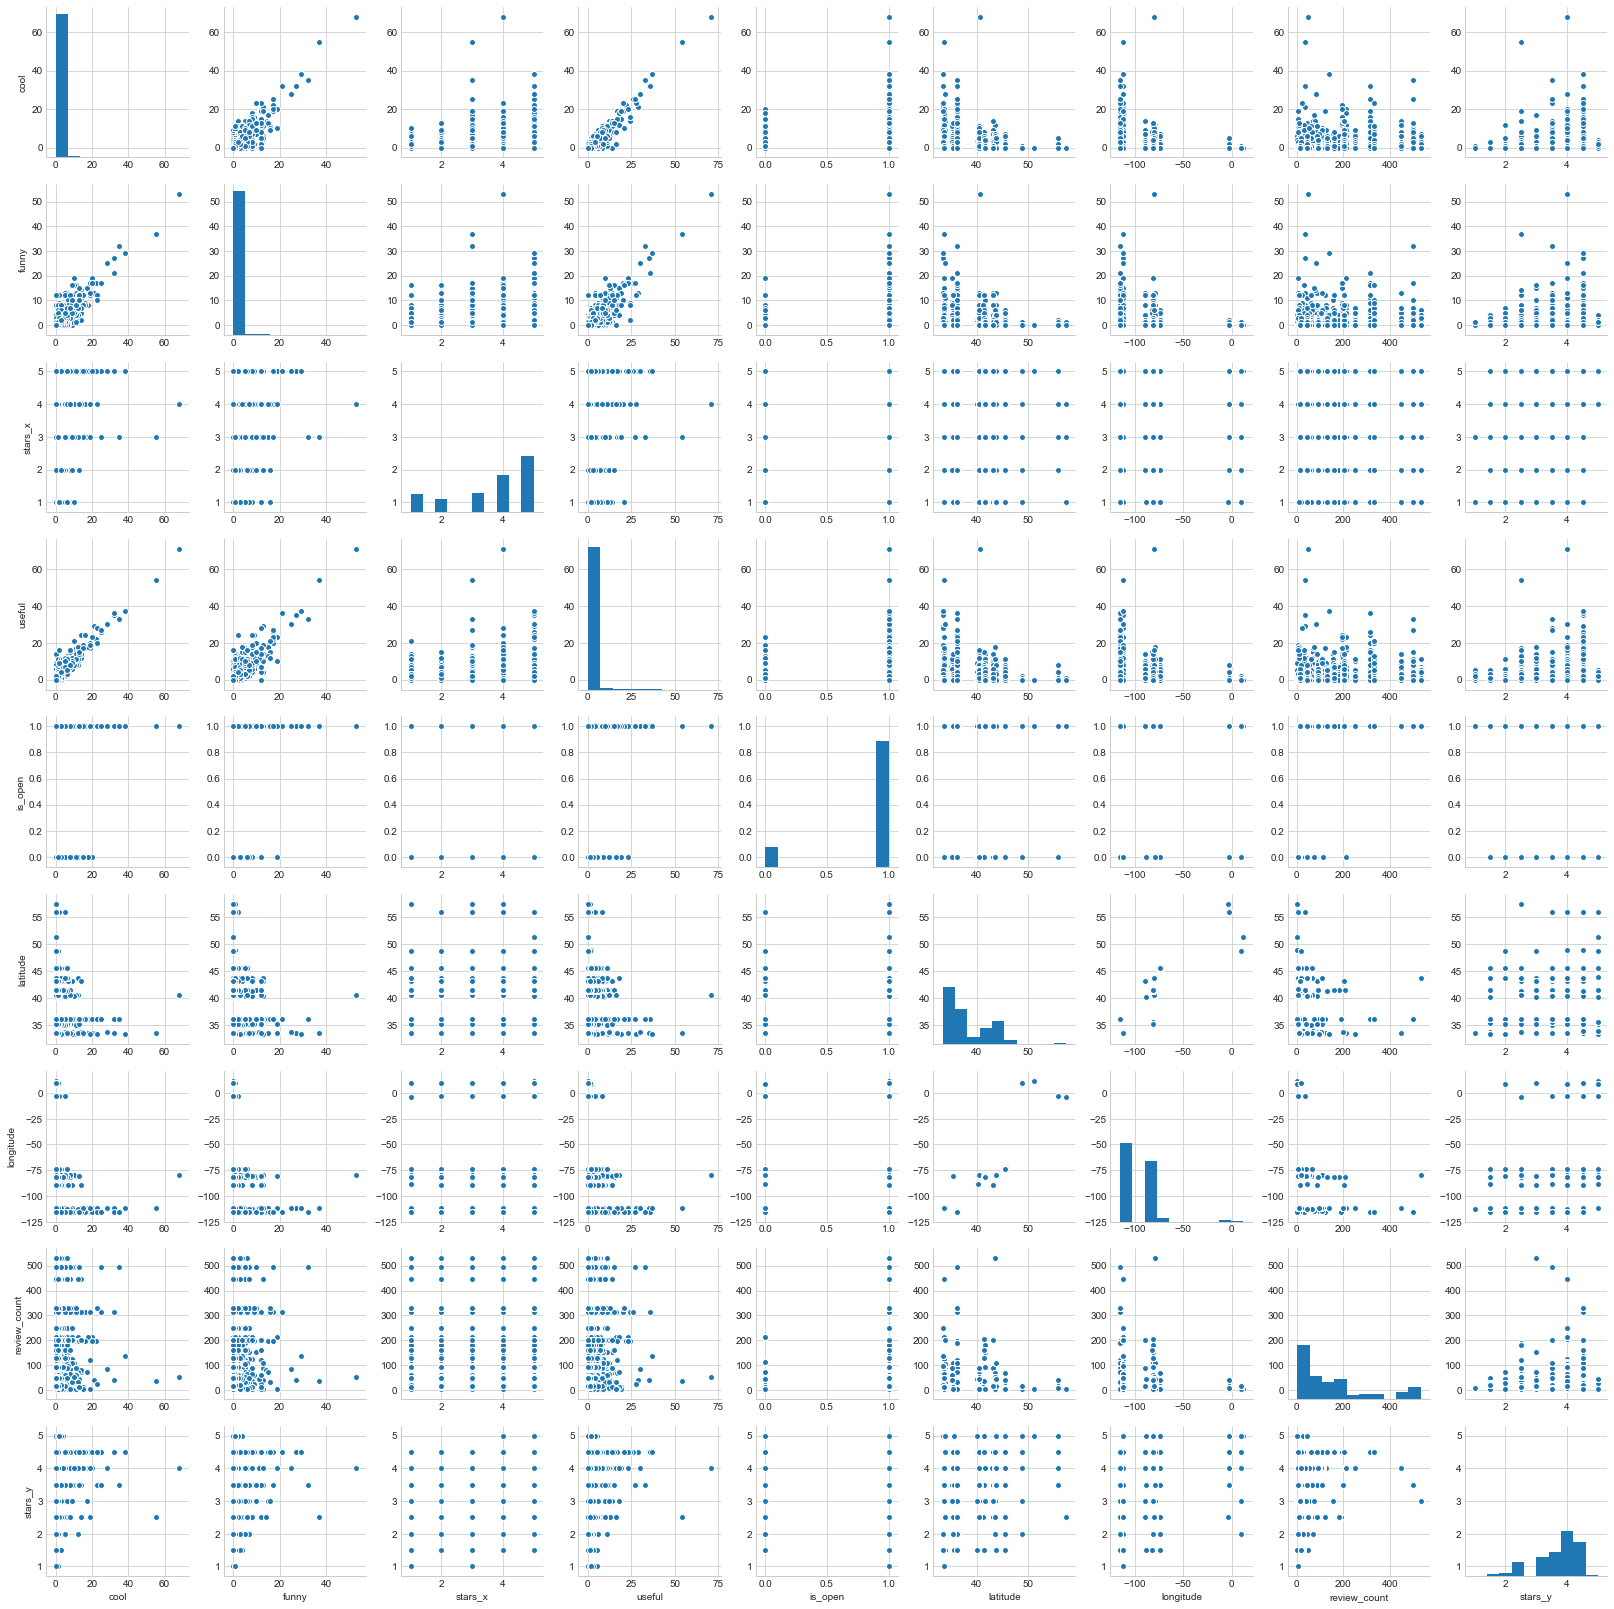
- Scatter plot various features
- Most Reviewed Restaurant
- Top 10 5 star rated Restaurant
- Distribution of review count with respect to Food Categories
- Distribution(count) of American, Mexican, Italian, Chinese Restaurant rating
- Top 20 American 5 star rated Restaurant
- High-count Top 10 users who reviewed Restaurant
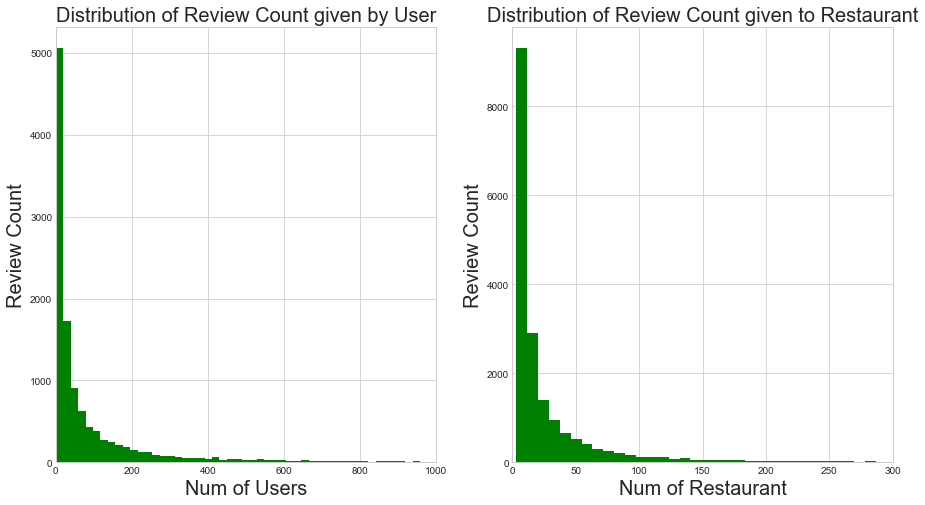
- Distribution of Review Count given by users and given to Restaurant
As we have large amounf data so we are loading data line by line in dataframe business_df, review_df, user_df
import json

def readjson(filepath):
    data = []
    i=0
    with open(filepath,encoding="utf8") as f:
            for line in f:
                 if i<100000:
                    data.append(json.loads(line))
                    #print(i)
                    i +=1
    return pd.DataFrame(data)

business_df = readjson('./dataset/business.json')
review_df = readjson('./dataset/review.json')
user_df = readjson('./dataset/user.json')
Getting reaturants out of business dataframe based on Food category
business_df['categories'] = business_df['categories'].astype(str)
restaurant_df = business_df[business_df['categories'].str.contains('Food')==True]

complete_df = restaurant_df.merge(review_df,on='business_id').merge(user_df,on='user_id')
complete_df.head(2)
| address | attributes | business_id | categories | city | hours | is_open | latitude | longitude | name_x | neighborhood | postal_code | review_count_x | stars_x | state | cool_x | date | funny_x | review_id | stars_y | text | useful_x | user_id | average_stars | compliment_cool | compliment_cute | compliment_funny | compliment_hot | compliment_list | compliment_more | compliment_note | compliment_photos | compliment_plain | compliment_profile | compliment_writer | cool_y | elite | fans | friends | funny_y | name_y | review_count_y | useful_y | yelping_since | |
|---|---|---|---|---|---|---|---|---|---|---|---|---|---|---|---|---|---|---|---|---|---|---|---|---|---|---|---|---|---|---|---|---|---|---|---|---|---|---|---|---|---|---|---|---|
| 0 | 1203 E Charleston Blvd, Ste 140 | {'BusinessParking': {'validated': False, 'gara... | YTqtM2WFhcMZGeAGA08Cfg | ['Seafood', 'Restaurants', 'Specialty Food', '... | Las Vegas | {'Sunday': '10:15-21:00', 'Wednesday': '10:30-... | 1 | 36.159363 | -115.135949 | Mariscos Playa Escondida | Downtown | 89104 | 330 | 4.5 | NV | 0 | 2016-09-16 | 1 | ZH8g_PoY0Tr3YdQ-RGySrA | 5 | Great place. There was a man here who was very... | 1 | EDe16577dBImA1ypOzPlKg | 5.00 | 0 | 0 | 0 | 0 | 0 | 0 | 0 | 0 | 0 | 0 | 0 | 0 | [] | 0 | [] | 0 | Jessica | 1 | 0 | 2014-07-26 |
| 1 | 1203 E Charleston Blvd, Ste 140 | {'BusinessParking': {'validated': False, 'gara... | YTqtM2WFhcMZGeAGA08Cfg | ['Seafood', 'Restaurants', 'Specialty Food', '... | Las Vegas | {'Sunday': '10:15-21:00', 'Wednesday': '10:30-... | 1 | 36.159363 | -115.135949 | Mariscos Playa Escondida | Downtown | 89104 | 330 | 4.5 | NV | 1 | 2014-11-13 | 1 | 6r2uAJE1dqUq1IHn_3R3qA | 4 | HOT HOT HOT! Real Mexican Food\n\nNO fake wate... | 2 | twx2ZgFUbat87vGQ_tFbPA | 3.55 | 0 | 0 | 0 | 2 | 0 | 1 | 3 | 0 | 5 | 0 | 0 | 11 | [] | 3 | [eFObFWgDiQJwUiy9WlhOfg, W4KL3Q_AVGfRrWcwR60gK... | 29 | Edwin | 94 | 317 | 2010-12-30 |
restaurant_df.describe()
| is_open | latitude | longitude | review_count | stars | |
|---|---|---|---|---|---|
| count | 18503.00000 | 18503.000000 | 18503.000000 | 18503.000000 | 18503.000000 |
| mean | 0.83073 | 39.702568 | -87.807760 | 34.804464 | 3.546857 |
| std | 0.37500 | 5.747548 | 27.691971 | 82.946472 | 0.889710 |
| min | 0.00000 | -34.520401 | -119.551325 | 3.000000 | 1.000000 |
| 25% | 1.00000 | 35.135615 | -112.013439 | 5.000000 | 3.000000 |
| 50% | 1.00000 | 40.440368 | -81.357777 | 11.000000 | 3.500000 |
| 75% | 1.00000 | 43.665419 | -79.414244 | 31.000000 | 4.000000 |
| max | 1.00000 | 59.438181 | 11.769500 | 3439.000000 | 5.000000 |
user_df.describe()
| average_stars | compliment_cool | compliment_cute | compliment_funny | compliment_hot | compliment_list | compliment_more | compliment_note | compliment_photos | compliment_plain | compliment_profile | compliment_writer | cool | fans | funny | review_count | useful | |
|---|---|---|---|---|---|---|---|---|---|---|---|---|---|---|---|---|---|
| count | 100000.000000 | 100000.000000 | 100000.000000 | 100000.000000 | 100000.000000 | 100000.000000 | 100000.000000 | 100000.000000 | 100000.000000 | 100000.000000 | 100000.000000 | 100000.000000 | 100000.000000 | 100000.000000 | 100000.000000 | 100000.000000 | 100000.000000 |
| mean | 3.729684 | 16.342210 | 0.950070 | 16.342210 | 12.015470 | 0.416970 | 1.465460 | 6.980040 | 5.491070 | 15.870480 | 1.046280 | 6.151540 | 91.215580 | 5.103230 | 64.731610 | 66.524450 | 120.838970 |
| std | 0.835715 | 197.424646 | 16.639768 | 197.424646 | 175.458886 | 7.165452 | 15.762362 | 70.410324 | 153.225409 | 194.113025 | 19.474635 | 73.883346 | 1509.129416 | 29.803631 | 1049.502721 | 178.975429 | 1610.123217 |
| min | 1.000000 | 0.000000 | 0.000000 | 0.000000 | 0.000000 | 0.000000 | 0.000000 | 0.000000 | 0.000000 | 0.000000 | 0.000000 | 0.000000 | 0.000000 | 0.000000 | 0.000000 | 0.000000 | 0.000000 |
| 25% | 3.350000 | 0.000000 | 0.000000 | 0.000000 | 0.000000 | 0.000000 | 0.000000 | 0.000000 | 0.000000 | 0.000000 | 0.000000 | 0.000000 | 0.000000 | 0.000000 | 0.000000 | 5.000000 | 0.000000 |
| 50% | 3.810000 | 0.000000 | 0.000000 | 0.000000 | 0.000000 | 0.000000 | 0.000000 | 0.000000 | 0.000000 | 0.000000 | 0.000000 | 0.000000 | 0.000000 | 0.000000 | 0.000000 | 16.000000 | 2.000000 |
| 75% | 4.240000 | 1.000000 | 0.000000 | 1.000000 | 0.000000 | 0.000000 | 0.000000 | 1.000000 | 0.000000 | 1.000000 | 0.000000 | 1.000000 | 2.000000 | 2.000000 | 3.000000 | 50.000000 | 13.000000 |
| max | 5.000000 | 16710.000000 | 2146.000000 | 16710.000000 | 19988.000000 | 1265.000000 | 1576.000000 | 6340.000000 | 33297.000000 | 13075.000000 | 2232.000000 | 7117.000000 | 175230.000000 | 1837.000000 | 103514.000000 | 11065.000000 | 187179.000000 |
review_df.describe()
| cool | funny | stars | useful | |
|---|---|---|---|---|
| count | 100000.000000 | 100000.000000 | 100000.000000 | 100000.00000 |
| mean | 0.532470 | 0.411740 | 3.730530 | 1.01213 |
| std | 1.992121 | 1.655608 | 1.418456 | 2.46252 |
| min | 0.000000 | 0.000000 | 1.000000 | 0.00000 |
| 25% | 0.000000 | 0.000000 | 3.000000 | 0.00000 |
| 50% | 0.000000 | 0.000000 | 4.000000 | 0.00000 |
| 75% | 0.000000 | 0.000000 | 5.000000 | 1.00000 |
| max | 104.000000 | 114.000000 | 5.000000 | 113.00000 |
review_df.head(2)
| business_id | cool | date | funny | review_id | stars | text | useful | user_id | |
|---|---|---|---|---|---|---|---|---|---|
| 0 | uYHaNptLzDLoV_JZ_MuzUA | 0 | 2016-07-12 | 0 | VfBHSwC5Vz_pbFluy07i9Q | 5 | My girlfriend and I stayed here for 3 nights a... | 0 | cjpdDjZyprfyDG3RlkVG3w |
| 1 | uYHaNptLzDLoV_JZ_MuzUA | 0 | 2016-10-02 | 0 | 3zRpneRKDsOPq92tq7ybAA | 3 | If you need an inexpensive place to stay for a... | 0 | bjTcT8Ty4cJZhEOEo01FGA |
Performing Exploratory data analysis
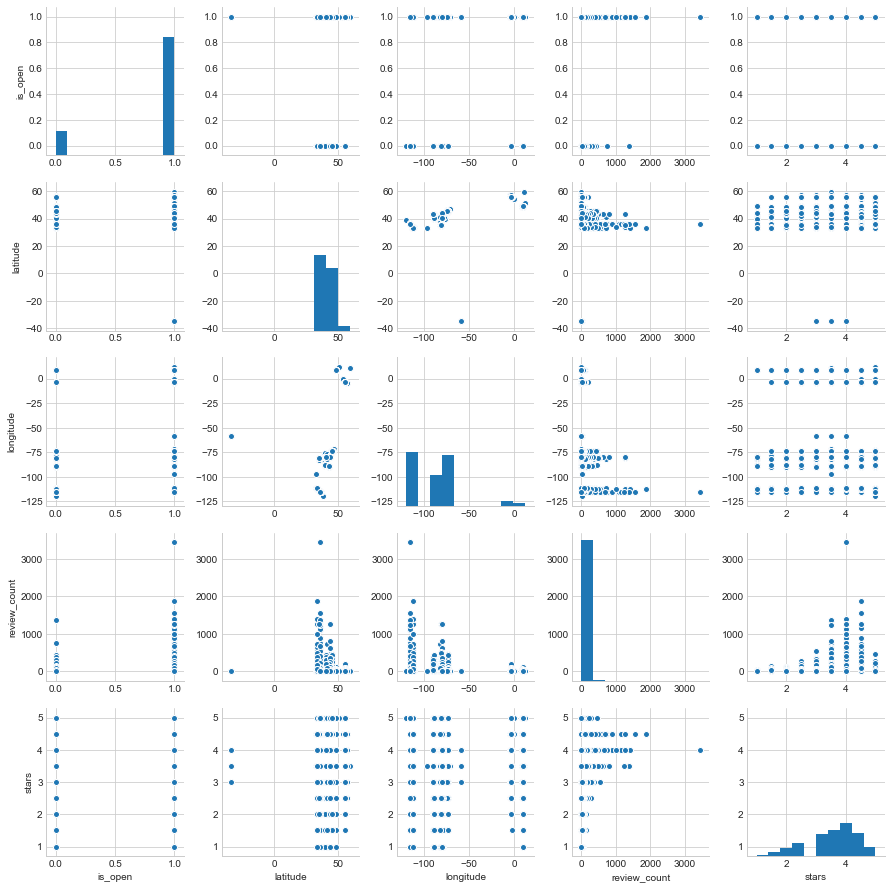
sns.pairplot(restaurant_df.iloc[0:10000,:]);
Distribution count of Restaurant rating
We can see below more restaurants get 4 rating than other ratings
fig, ax = plt.subplots(nrows=1, ncols=1, figsize=(15, 5))

sns.distplot(restaurant_df.stars,kde=False,color = 'g',ax =ax,bins=20);
ax.axvline(restaurant_df.stars.mean(), 0, 1, color='r', label='Mean')
ax.legend();
ax.set_ylabel('Count',size=20)
ax.set_xlabel('Stars',size=20)
ax.set_title('Distribution(count) of Restaurant rating',size=20);
Distribution count of Reviews rating for restaurants
We can see below more reviews have 5 rating than other ratings
#review just for business which are restautrant
review_df_filter_df = review_df.merge(restaurant_df,how='inner',on='business_id')

fig, ax = plt.subplots(nrows=1, ncols=1, figsize=(15, 5))
sns.distplot(review_df_filter_df.stars_x,kde=False,color = 'g',ax =ax,bins=20);
ax.axvline(review_df_filter_df.stars_x.mean(), 0, 1, color='r', label='Mean')
ax.legend();
ax.set_ylabel('Count',size=20)
ax.set_xlabel('Stars',size=20)
ax.set_title('Distribution(count) of different Reviews rating',size=20)
Text(0.5,1,'Distribution(count) of different Reviews rating')
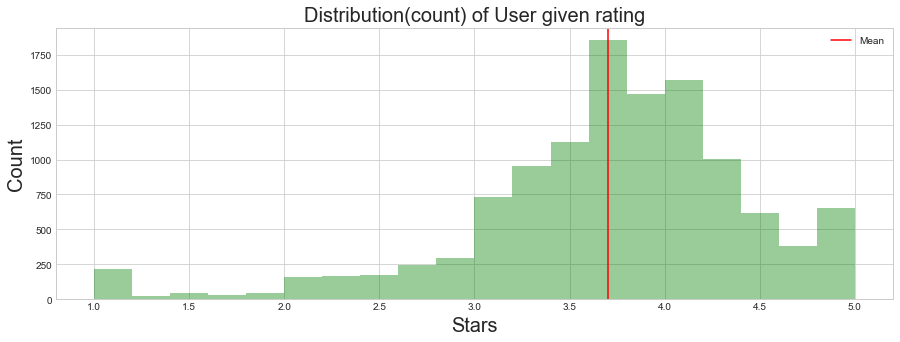
Distribution count of user rating for restaurants
We can see below users have around mean of 3.7 rating
#user just for business which are restautrant
user_df_filter_df = complete_df.groupby(['user_id'],as_index=False).mean()

fig, ax = plt.subplots(nrows=1, ncols=1, figsize=(15, 5))
sns.distplot(user_df_filter_df.average_stars,kde=False,color = 'g',ax =ax,bins=20);
ax.axvline(user_df_filter_df.average_stars.mean(), 0, 1, color='r', label='Mean')
ax.legend();
ax.set_ylabel('Count',size=20)
ax.set_xlabel('Stars',size=20)
ax.set_title('Distribution(count) of User given rating',size=20)

#fig.tight_layout()
Text(0.5,1,'Distribution(count) of User given rating')
Scatter plot various features
We can see that useful, funny and cool are correlated
sns.pairplot(review_df_filter_df.iloc[0:10000,:]);
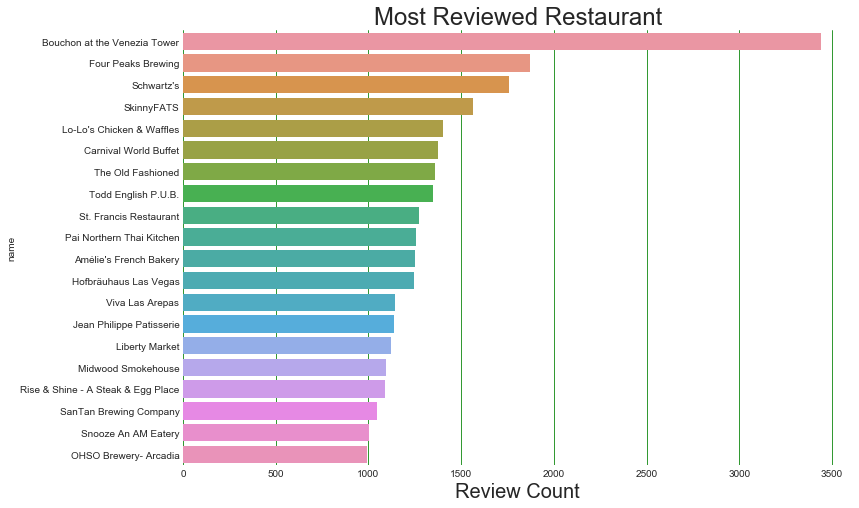
Most Reviewed Restaurant
Bouchon at the Venezia Tower is reviewed almost double as compared to others
#get top 20 most reviewed restaurants
n_top =20
most_reviewed_restaurant = restaurant_df.nlargest(n_top, 'review_count')
fig, ax = plt.subplots()
ax = sns.barplot(y="name", x="review_count", data=most_reviewed_restaurant)
ax.set_xlabel('Review Count',size=20)
fig.set_size_inches(12, 8)
plt.title("Most Reviewed Restaurant",fontsize=24);
ax.grid(axis = 'x', color ='green', linestyle='-')
ax.tick_params(axis='both', which='both',length=0)
sns.despine(left=True, bottom=True)
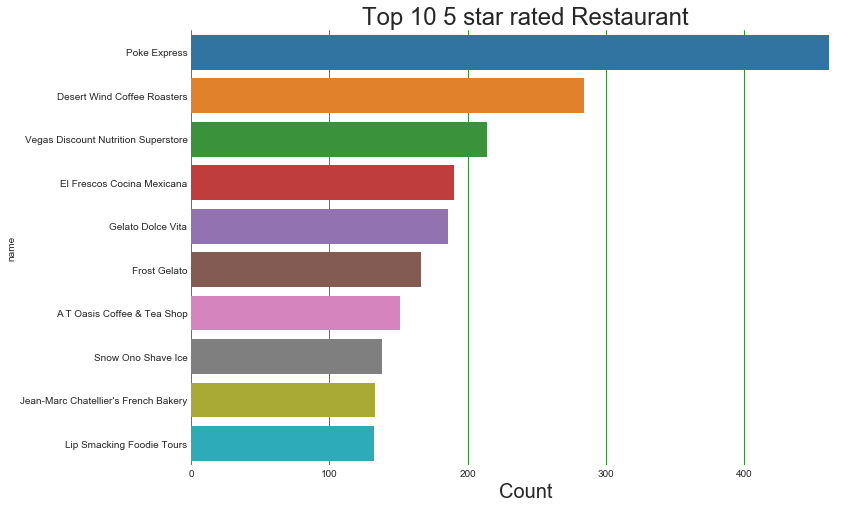
Top 10 5 star rated Restaurant
Poke Express is the top 5 star rated restaurant
top_rated_restaurant = restaurant_df.sort_values(by=['stars','review_count'],
                                                 ascending=False)[['name','business_id','review_count','stars']]
#get top 10 5 star rated restaurant
n_top =10
top_rated_restaurant = top_rated_restaurant.nlargest(n_top, 'stars')
fig, ax = plt.subplots()
ax = sns.barplot(y="name", x="review_count", data=top_rated_restaurant)
ax.set_xlabel('Count',size=20)
fig.set_size_inches(12, 8)
plt.title("Top 10 5 star rated Restaurant",fontsize=24);
ax.grid(axis = 'x', color ='green', linestyle='-')
ax.tick_params(axis='both', which='both',length=0)
sns.despine(left=True, bottom=True)
Getting different food categories from the restaurant dataframe
top_rated_restaurant = restaurant_df.sort_values(by=['stars','review_count'],
                                                 ascending=False)[['name','business_id','review_count','stars']]
#top_rated_restaurant
def get_food_type_count(category):
    count = restaurant_df[restaurant_df['categories'].str.contains(category)==True]['business_id'].count()
    return count
food_dict = {}
food_categories = ['American','Italian','Mexican','Chinese','Thai','Indian','Japan','French']
for food_category in food_categories:
    food_dict[food_category] = get_food_type_count(food_category)
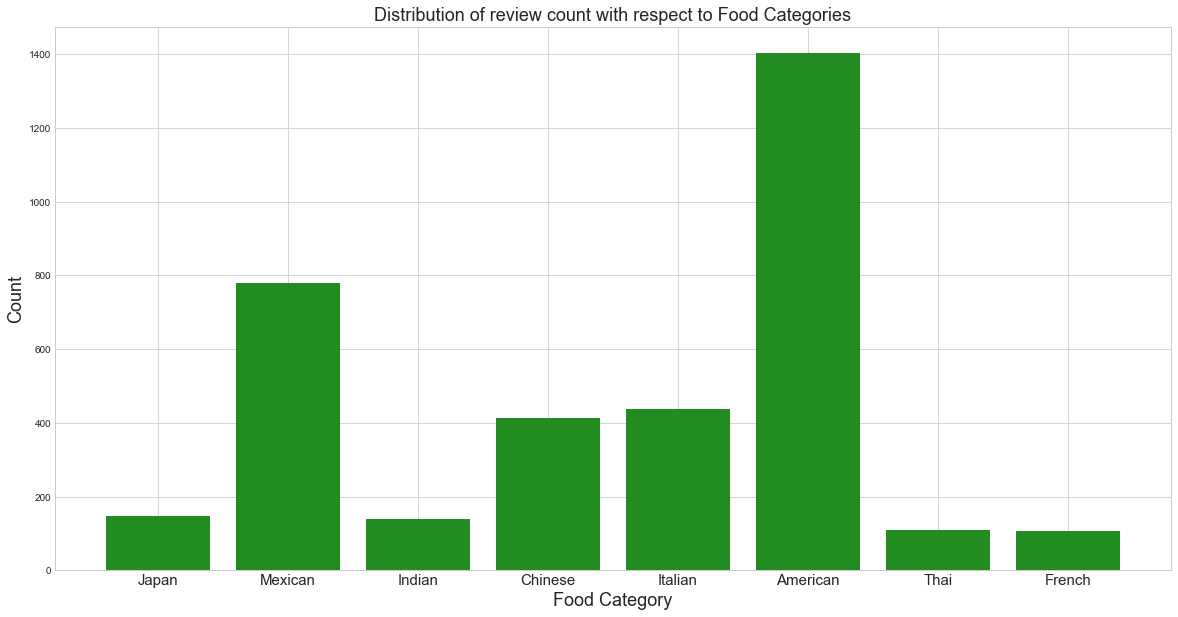
Distribution of review count with respect to Food Categories
We can see American restaurant have higher count of reviews followed by Mexican
plt.figure(figsize=(20,10))
plt.bar(range(len(food_dict)), food_dict.values(), align='center',color='forestgreen')
plt.xticks(range(len(food_dict)), list(food_dict.keys()),fontsize = 15);
plt.title('Distribution of review count with respect to Food Categories',fontsize=18)
plt.xlabel('Food Category',fontsize=18)
plt.ylabel('Count',fontsize=18)
Text(0,0.5,'Count')
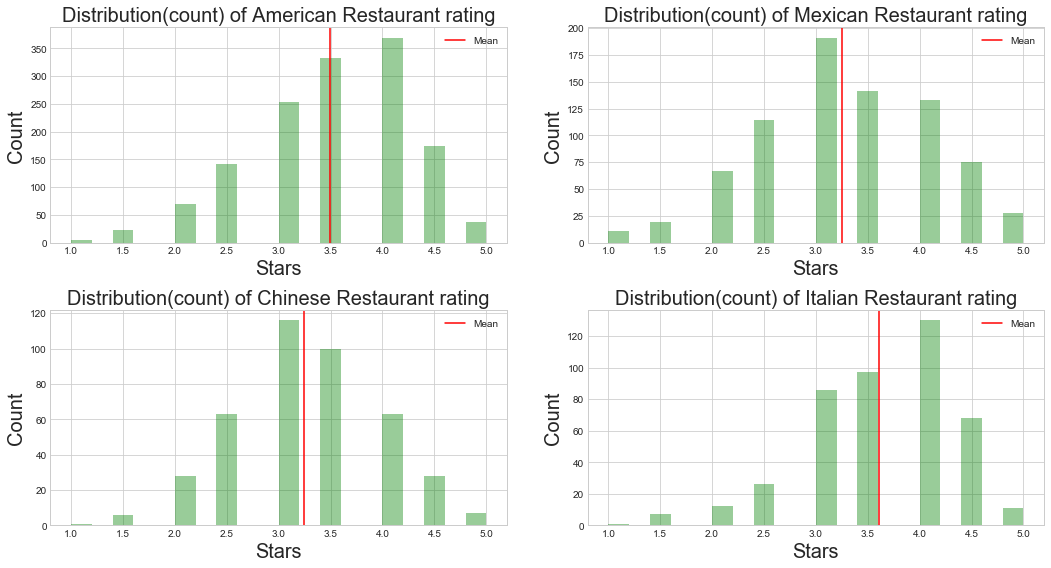
Distribution(count) of American, Mexican, Italian, Chinese Restaurant rating
We can see American and Italian restaurants are rated higher than other restaurants
American_restaurant_rating_df = restaurant_df[restaurant_df['categories'].str.contains('American')==True][['business_id','stars','categories','name','review_count']]
Mexican_restaurant_rating_df = restaurant_df[restaurant_df['categories'].str.contains('Mexican')==True][['business_id','stars','categories','name','review_count']]
Chinese_restaurant_rating_df = restaurant_df[restaurant_df['categories'].str.contains('Chinese')==True][['business_id','stars','categories','name','review_count']]
Italian_restaurant_rating_df = restaurant_df[restaurant_df['categories'].str.contains('Italian')==True][['business_id','stars','categories','name','review_count']]

fig, ax = plt.subplots(nrows=2, ncols=2, figsize=(15, 8))
ax = ax.ravel()

def restaurant_category(df, title, ax):

    sns.distplot(df.stars,kde=False,color = 'g',ax =ax,bins=20);
    ax.axvline(df.stars.mean(), 0, 1, color='r', label='Mean')
    ax.legend();
    ax.set_ylabel('Count',size=20)
    ax.set_xlabel('Stars',size=20)
    ax.set_title('Distribution(count) of '+ title + ' Restaurant rating',size=20);

restaurant_category(American_restaurant_rating_df, 'American', ax[0])
restaurant_category(Mexican_restaurant_rating_df, 'Mexican', ax[1])
restaurant_category(Chinese_restaurant_rating_df, 'Chinese', ax[2])
restaurant_category(Italian_restaurant_rating_df, 'Italian', ax[3])

plt.tight_layout()
American_restaurant_rating_df.head(2)
| business_id | stars | categories | name | review_count | |
|---|---|---|---|---|---|
| 34 | reWc1g65PNZnKz_Ub9QKOQ | 2.5 | ['Comfort Food', 'Canadian (New)', 'Restaurant... | Milestones Restaurants | 51 |
| 55 | Z1r6b30Tg0n0ME4-Zj2wQQ | 3.0 | ['American (Traditional)', 'Restaurants', 'Bar... | Boardwalk Place | 13 |
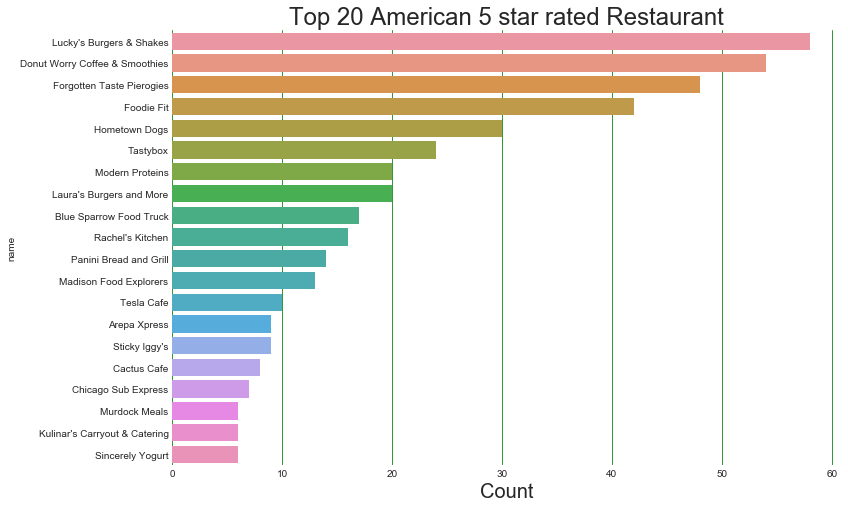
Top 20 American 5 star rated Restaurant
American_top_rated_restaurant = American_restaurant_rating_df.sort_values(by=['stars','review_count'],
                                                 ascending=False)[['name','business_id','review_count','stars']]
#get top 20 5 star rated restaurant
n_top =20
American_top_rated_restaurant = American_top_rated_restaurant.nlargest(n_top, 'stars')
fig, ax = plt.subplots()
ax = sns.barplot(y="name", x="review_count", data=American_top_rated_restaurant)
ax.set_xlabel('Count',size=20)
fig.set_size_inches(12, 8)
plt.title("Top 20 American 5 star rated Restaurant",fontsize=24);
ax.grid(axis = 'x', color ='green', linestyle='-')
ax.tick_params(axis='both', which='both',length=0)
sns.despine(left=True, bottom=True)
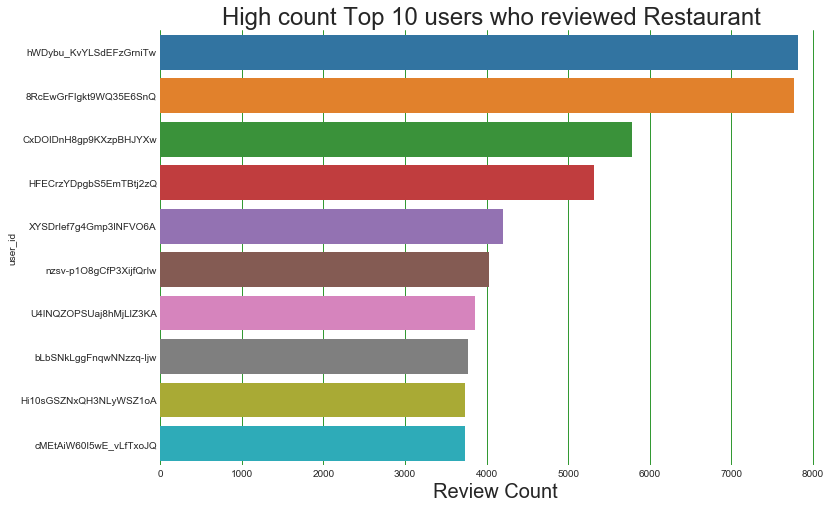
High-count Top 10 users who reviewed Restaurant
#get top 10 most reviewing users
n_top =10
most_review_user = user_df_filter_df.nlargest(n_top, 'review_count_y').reindex()
fig, ax = plt.subplots()
ax = sns.barplot(y="user_id", x="review_count_y", data=most_review_user)
ax.set_xlabel('Review Count',size=20)
fig.set_size_inches(12, 8)
plt.title("High count Top 10 users who reviewed Restaurant ",fontsize=24);
ax.grid(axis = 'x', color ='green', linestyle='-')
ax.tick_params(axis='both', which='both',length=0)
sns.despine(left=True, bottom=True)
Distribution of Review Count given by users and given to Restaurant
We can see that most review count is with less number of users and restaurants
fig, ax = plt.subplots(nrows=1, ncols=2, figsize=(15, 8))
user_df_filter_df.review_count_y.hist(bins=400,ax=ax[0],color = 'g')
#plt.xlim([0,1000])
ax[0].legend();
ax[0].set_xlim([0,1000])
ax[0].set_ylabel('Review Count',size=20)
ax[0].set_xlabel('Num of Users',size=20)
ax[0].set_title('Distribution of Review Count given by User',size=20);

restaurant_df.review_count.hist(bins=400,ax=ax[1],color = 'g')
ax[1].set_xlim([0,300])
ax[1].legend();
ax[1].set_ylabel('Review Count',size=20)
ax[1].set_xlabel('Num of Restaurant',size=20)
ax[1].set_title('Distribution of Review Count given to Restaurant',size=20);
